Accounting Firm KPI Dashboard: Metrics That Matter
Most CPA firm owners know their revenue but can't name their realization rate or average days-to-invoice — that's a dashboard gap, not a knowledge gap. This guide breaks down exactly which KPIs belong on your accounting firm dashboard, what benchmarks to measure against, and how AI-native tools surface these metrics automatically. Stop running your firm on intuition and start making decisions backed by real-time data.
Most CPA firm owners can tell you last month's revenue. Ask them their realization rate, average days-to-invoice, or document error rate — and you'll get a pause. That's not a knowledge gap. It's a dashboard gap. The accounting firm KPI dashboard most firms are running is either a spreadsheet someone updates quarterly, a report they pull manually from three different tools, or nothing at all.
That's a structural problem. And it costs real money.
This guide is the operational follow-up to choosing your practice management platform. Once you have the system in place, here's exactly which KPIs to display, what benchmarks to measure against, and how AI-native tools surface these metrics automatically — so you're managing from data instead of intuition. Think of this as your blueprint for building an accounting firm KPI dashboard that goes beyond vanity metrics and actually drives decisions.
Why Most Accounting Firm KPI Dashboards Fail Before They Start
Before covering which metrics to track, it's worth understanding why most CPA firms never build a functioning dashboard in the first place. Building a functional accounting firm KPI dashboard fails not from lack of data, but from unclear ownership of what gets measured and why.
The typical firm tracks revenue because it appears automatically in QuickBooks or their billing software. Everything else — utilization, turnaround time, error rates, client satisfaction, pipeline stage distribution — requires pulling data from multiple disconnected tools, normalizing it manually, and updating a spreadsheet that's already stale by the time anyone reads it. This fragmentation is exactly why a purpose-built accounting firm KPI dashboard — one that consolidates these sources automatically — saves dozens of hours per month compared to spreadsheet-based reporting.
That's not a dashboard. That's a report you dread building.
The second problem is metric sprawl. A Google search for "CPA firm KPIs" will return lists of 30, 40, or even 50 metrics. Tracking all of them is as useless as tracking none of them. The firms that actually use KPI data to make decisions keep a tighter list — typically 8 to 12 metrics organized into three operational layers.
The third problem is that most practice management platforms don't surface metrics natively. TaxDome, for example, has strong pipeline and client portal features but no built-in analytics layer that connects document processing, billing, and team utilization in one view. Canopy's modular pricing means analytics costs extra. Karbon's Practice Intelligence is solid for email-centric workflows but wasn't built for tax-specific KPIs like return turnaround time or document validation error rates.
What accounting firm performance tracking actually requires is a platform where the metrics emerge from the workflow itself — not a separate reporting layer you have to manually feed. When every team member works inside a single system, the accounting firm KPI dashboard updates in real time rather than reflecting last week's exports.
The Three Layers of a Functional CPA Firm KPI Dashboard
Structure your accounting firm KPI dashboard around three operational layers: Revenue & Profitability, Operational Efficiency, and Client Experience. Each layer answers a different management question, and each requires different data sources.
Layer 1: Revenue & Profitability Metrics
These answer: Are we making money, and on which work?
1. Realization Rate The percentage of billed fees versus the value of hours worked at standard rates. Industry benchmark: 85–95% for well-run tax practices. If you're consistently below 85%, you're either under-billing or over-servicing — both are fixable with data.
2. Revenue Per Client Total revenue divided by active client count. Benchmark varies by firm type: small practices typically target $800–$1,500/year per individual client, with business clients substantially higher. Track this monthly to identify whether your client mix is shifting toward or away from profitable work. We covered this in depth in our guide to boosting CPA firm revenue growth without adding headcount.
3. Average Invoice Age / Days Sales Outstanding (DSO) How long it takes to collect after invoicing. Target: under 30 days. DSO creeping toward 45 or 60 days is an early warning sign — often caused by delayed invoicing rather than client payment behavior.
4. Revenue by Service Line Break revenue into tax prep, bookkeeping, advisory, and any other service categories. This tells you which services drive profitability versus which ones consume time without proportional return.
Layer 2: Operational Efficiency Metrics
These answer: Are we working efficiently, and where are the bottlenecks?
5. Average Return Turnaround Time From engagement acceptance to filed return. Benchmark: 7–10 business days for individual returns with complete documents. Tracking this per preparer surfaces training needs and workload distribution problems before they become client complaints.
6. Document Collection Rate The percentage of clients who have provided all required documents before their scheduled preparation date. Low document collection rates are the single biggest predictor of bottlenecks during tax season. A smart intake system with automated gap detection should push this above 80% before the preparer even touches the return.
7. Staff Utilization Rate Billable hours divided by total available hours. Target: 75–85% for preparer-level staff (leaving room for admin, training, and CPE). Consistently above 90% means staff are burning out. Consistently below 70% means capacity planning needs attention.
8. Pipeline Stage Distribution At any point during tax season, what percentage of your active returns are in each stage — New Client, Documents Requested, Documents Received, In Preparation, In Review, Awaiting Signature, Filed? A healthy accounting firm KPI dashboard should show a flowing pipeline with no single stage accumulating a disproportionate share of returns. A spike at any single stage indicates a systemic bottleneck.
Layer 3: Client Experience Metrics
These answer: Are clients getting the service experience that keeps them renewing?
9. Client Portal Adoption Rate The percentage of active clients using your client portal for document submission, communication, and e-signature. Higher portal adoption correlates directly with lower staff time per client and faster document collection. If this number is below 60%, your portal's onboarding experience may be creating friction.
10. E-Signature Completion Rate and Time What percentage of sent signature requests are completed, and how quickly? Unexecuted signatures are a silent deadline risk — especially for Form 8879 and engagement letters. Target: 95%+ completion within 48 hours.
11. Outstanding Invoice Rate The percentage of invoices unpaid past 30 days. Separate this from DSO — a low invoice age with high outstanding rate indicates a collections problem, not a billing timing problem.
Spending hours building reports that should already exist in your platform? See how TaxScout surfaces these metrics automatically through its analytics dashboards. → Book a 15-Min Demo — See It Live
 Click any extracted field to see its source highlighted on the original PDF
The Twelfth Metric Most Firms Miss: Document Error Rate
There's one KPI that almost no accounting firm KPI dashboard currently tracks, but which has an outsized impact on both profitability and compliance risk: document extraction error rate.
Every return that enters your pipeline is only as good as the data behind it. If your document intake process is manual entry or relies on basic OCR, your error rate is higher than you think — and it's invisible until something goes wrong.
As we detailed in our complete technical guide to AI document extraction for CPAs, the difference between basic OCR and a 5-layer validation pipeline is significant. TaxScout runs every document through five distinct validation layers:
- Layer 0 routes documents by confidence level (recognized, unrecognized, or junk)
- Layer 1 extracts fields with per-field confidence scoring from 0.0 to 1.0
- Layer 1.5 cross-verifies against OCR output using four matching strategies including fuzzy name matching
- Layer 2 applies 15 deterministic math rules — including phantom 1099-INT hallucination detection and W-2 component explosion detection
- Layer 3 runs 18 post-extraction validation rules covering tax math, cross-field checks, and foreign activity flags
The result is a measurable document accuracy rate that can appear directly on your accounting firm KPI dashboard. When a document fails validation, the system flags it before the preparer ever sees it — rather than after a return is submitted. This is the kind of metric that makes the difference between filing taxes more accurately with AI and discovering errors through IRS correspondence.
How AI-Native Platforms Surface KPIs Automatically vs. Manual Report-Building
Here's the practical difference between a platform designed for KPI visibility and one where you bolt analytics on top:
Manual report-building workflow (most platforms):
- Export billing data from invoicing tool
- Export pipeline stage data from workflow tool
- Export time entries from time tracking tool
- Normalize date formats across three exports
- Build pivot tables in Excel
- Update dashboard manually every week
- Discover the numbers are 5 days stale before the meeting starts
AI-native platform workflow (TaxScout):
- Pipeline management with 12 customizable stages auto-advances when conditions are met, recording timestamps at every transition
- Invoicing via Stripe Connect Express automatically logs invoice creation, sending, and payment dates
- Document extraction timestamps every processed document with validation status
- Three analytics dashboards on the Pro plan ($199/mo) aggregate this data in real time — no export, no normalization, no pivot tables
The key architectural difference: in TaxScout, the metrics emerge from the workflow as a byproduct of doing the work. Every time a preparer moves a return from "Documents Received" to "In Preparation," the turnaround-time clock updates. Every time a client pays an invoice, DSO recalculates. Every e-signature completion feeds the completion rate metric. The result is an accounting firm KPI dashboard that reflects what's actually happening in your firm right now — not what was happening when someone last ran a report.
This is what separates accounting dashboard software that works from reporting tools that require maintenance.
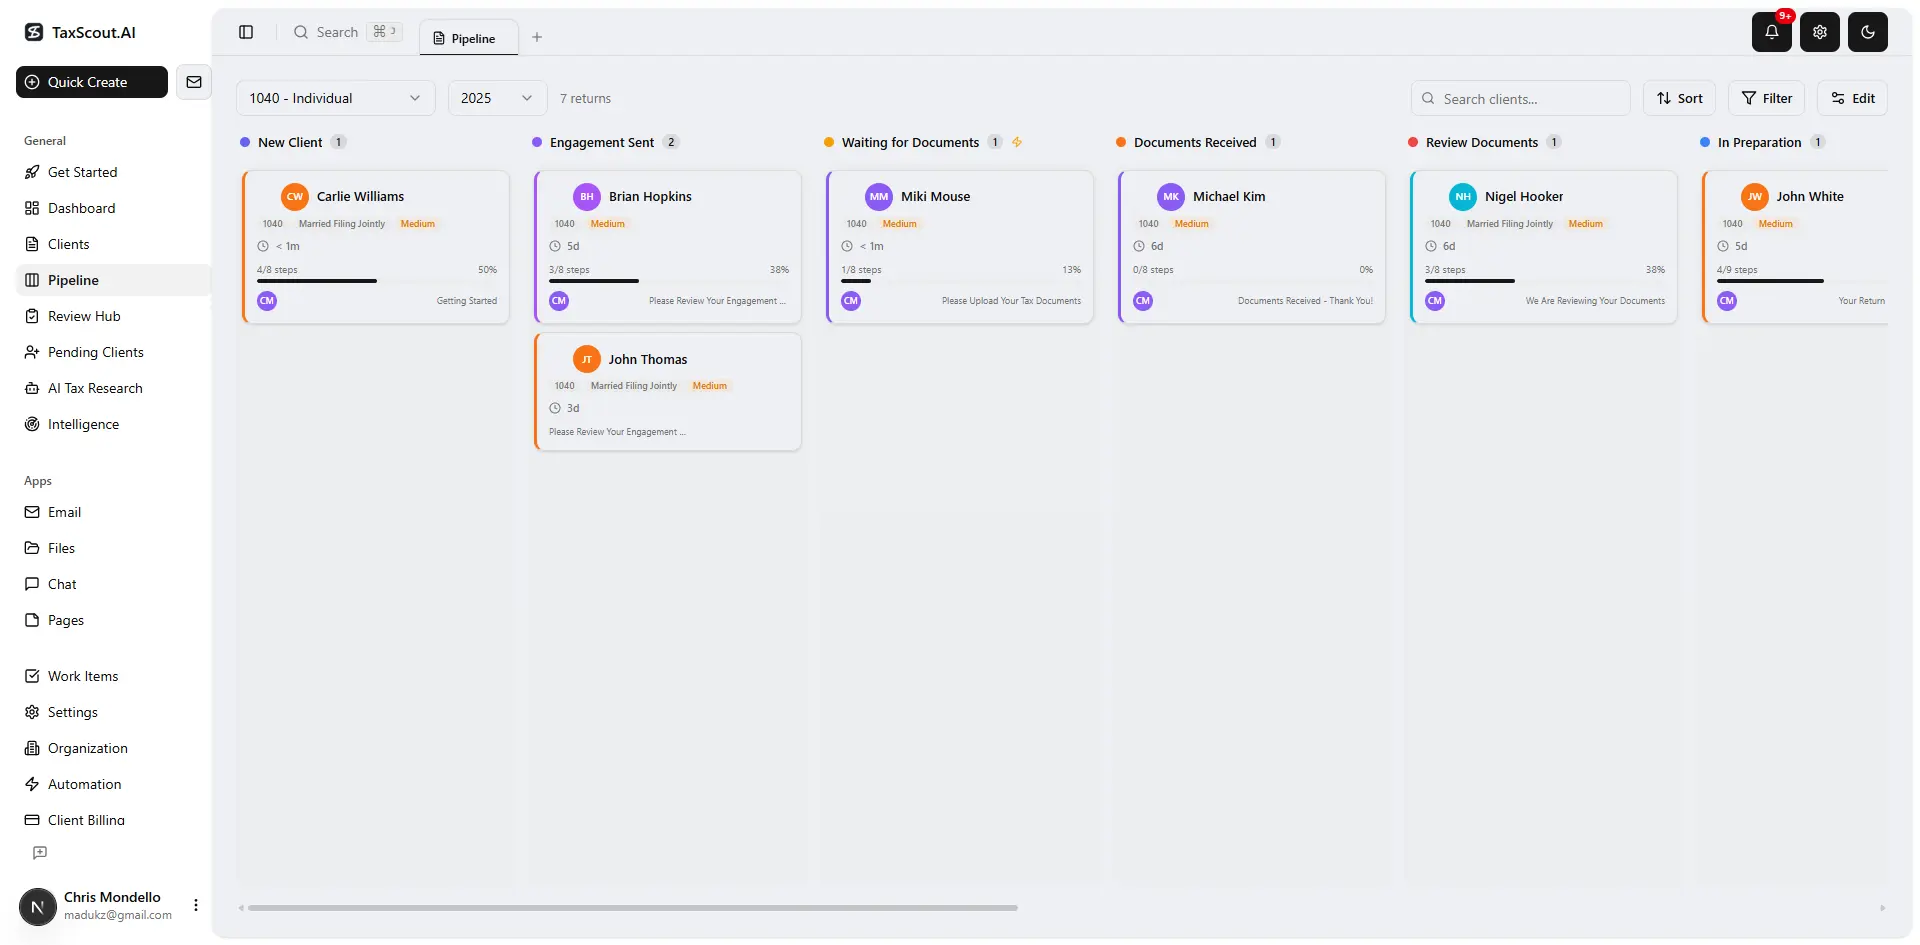 Track every return from intake to filed with drag-and-drop pipeline management
KPI Benchmarks Reference Table
| KPI | Target Benchmark | Warning Signal | Critical Signal |
|---|---|---|---|
| Realization Rate | 85–95% | Below 80% | Below 70% |
| Revenue Per Individual Client | $800–$1,500/yr | Below $600/yr | Below $400/yr |
| Days Sales Outstanding | Under 30 days | 31–45 days | Over 45 days |
| Return Turnaround Time | 7–10 business days | 11–15 days | Over 15 days |
| Document Collection Rate | 80%+ before prep date | 60–79% | Below 60% |
| Staff Utilization Rate | 75–85% | Below 65% or above 90% | Below 55% or above 95% |
| Client Portal Adoption | 80%+ | 60–79% | Below 60% |
| E-Signature Completion (48hr) | 95%+ | 85–94% | Below 85% |
| Outstanding Invoice Rate (30d+) | Under 10% | 10–20% | Over 20% |
Feature Comparison: KPI Visibility Across Platforms
| Feature | TaxScout | TaxDome | Canopy | Karbon |
|---|---|---|---|---|
| Built-in analytics dashboards | ✅ 3 dashboards (Pro) | ❌ | ❌ (add-on module cost) | ✅ Practice Intelligence |
| Pipeline stage timestamps | ✅ Auto-recorded | ✅ | ✅ | ✅ |
| Document validation metrics | ✅ Per-field confidence scoring | ❌ | ❌ | ❌ |
| E-signature completion tracking | ✅ | ✅ | ✅ | ⚠️ Rolling out |
| Revenue per client reporting | ✅ | ⚠️ Basic | ⚠️ Basic | ❌ |
| Turnaround time by preparer | ✅ | ⚠️ Manual export | ⚠️ | ✅ |
| Real-time IRS research alerts | ✅ | ❌ | ❌ | ❌ |
| Pricing (10-person firm) | $199/mo flat | ~$1,000/mo | ~$660/mo | ~$590/mo |
For a detailed comparison of how TaxScout stacks up against the market leaders, see TaxScout vs TaxDome 2026 and TaxScout vs Canopy 2026.
Real-World KPI Dashboard in Action: A Mid-Season Scenario
It's February 12th. Your firm has 87 active returns in the pipeline. Here's what a functional accounting firm KPI dashboard tells you versus what it tells you without one.
Without a dashboard: The managing partner sends Slack messages asking where things stand. Each preparer updates a shared spreadsheet. Someone's numbers are from two days ago. The review bottleneck isn't visible until Thursday's team meeting — four days after it started forming.
With a TaxScout dashboard: At 9:00 AM, the pipeline stage distribution shows 23 returns in "In Review" — up from 14 the day before. The reviewing partner's utilization rate is at 94%. Average turnaround time for the current week is trending toward 13 days, above the 10-day target. The document collection rate dashboard shows 12 active clients with incomplete document packages.
The managing partner sees these numbers before coffee. They redistribute two returns to a second reviewer, trigger automated follow-up messages to the 12 incomplete-document clients, and adjust the staffing schedule for the following week. The bottleneck that would have cost a week of delays is resolved in 20 minutes.
This is what KPI tracking accounting looks like when it's embedded in the platform rather than bolted on top.
The IRS recommends that tax preparers maintain documented quality control procedures — and a functioning KPI dashboard is the operational backbone of exactly that kind of systematic quality control. The AICPA's practice management resources similarly emphasize measurable firm performance as a core professional standard.
Building Your Dashboard: A Practical Starting Point
If you're implementing an accounting firm KPI dashboard from scratch, start with four metrics and expand from there. The temptation to track everything simultaneously is how firms end up with dashboards nobody checks.
Month 1: Track pipeline stage distribution, return turnaround time, document collection rate, and DSO. These four metrics alone will surface the most common bottlenecks.
Month 2: Add realization rate, staff utilization, and e-signature completion rate once you have baseline data for the first four.
Month 3: Add revenue by service line, client portal adoption, and document error rate.
Review your metrics weekly during tax season, monthly during off-season. Set a single "owner" for each metric — the person responsible for explaining variance and proposing responses. A metric with no owner is a metric nobody watches.
As we explored in our guide to CPA firm workflow automation, the goal isn't to generate more reports — it's to eliminate the decisions that require a report in the first place. Automated alerts when a metric crosses a threshold are more valuable than weekly dashboard reviews for most operational KPIs.
Ready to See Your Firm's Metrics in Real Time?
TaxScout gives your firm three built-in analytics dashboards, AI-automated pipeline tracking, and document validation metrics — all for $199/mo flat for your entire team.
No manual exports. No pivot tables. No stale numbers in Monday morning meetings.
Check out our transparent flat pricing to see how much your firm can save.
Frequently Asked Questions
An effective accounting firm KPI dashboard should track six core metric categories that most firms miss: realization rate (billable hours billed vs. collected), average days-to-invoice, document error rate, staff utilization rate, client pipeline stage distribution, and client satisfaction scores. TaxScout's dashboard surfaces all six automatically by pulling data from your existing workflows — no manual spreadsheet updates or cross-tool reporting required. Firms using TaxScout report seeing their realization rate and turnaround metrics in real time for the first time, typically within the first week of setup.
Read next
The Silent Killer of Tax Firm Retention: Why Intake Communication is Breaking Your Workflow
Most CPA firms analyze churn after clients leave — but the damage starts at intake. Discover why your first communication touchpoints are silently eroding retention and what to do about it. Fix the intake gap and clients stay before they ever think of leaving.
CPA Software Price Hikes: Private Equity's Tax Practice Squeeze
Private equity acquisitions of major accounting software vendors are squeezing CPA firms with annual price hikes, punishing per-user pricing, and bundled ecosystems designed to trap you. The firms winning this battle are the ones that audit their stack before renewal season — not during it. Here's how to take back control of your tech margins.
Firing Your Worst Clients: A Practical Guide to Enforcing Strict Boundaries in Your CPA Practice
Not every client deserves a renewal. High-performing CPA firms know that firing problem clients — those who drain time, dispute invoices, and ignore deadlines — is often the highest-ROI decision a firm owner can make. This guide walks you through the when, the why, and the professional how of strategic client disengagement.
Stay up to date
Get the latest tax tech insights delivered to your inbox.