Engagement Profitability Analysis: How CPAs Find Which Clients Actually Make Money
Most CPA firms track revenue. Far fewer track profit at the individual engagement level — and that gap is where margin quietly disappears. This guide walks through the operational mechanics of engagement profitability analysis: how to calculate true cost per client, identify scope creep patterns, benchmark realization rates, and make data-driven decisions about repricing, restructuring, or exiting unprofitable relationships.
Engagement profitability analysis is the discipline of measuring net margin at the individual client or project level — not just revenue, not just billable hours, but actual profit after accounting for labor cost, overhead allocation, unbilled time, and scope creep. For most CPA firms, this number is unknown. Revenue looks healthy on the P&L, but a handful of clients quietly consume 40% of capacity while generating 15% of profit.
The problem is structural. Firms price engagements at the proposal stage, then absorb overruns silently throughout the year. Flat-fee arrangements make it easy to ignore effective hourly rates. Value-priced clients get re-scoped informally via email without a corresponding fee adjustment. By the time a managing partner suspects a client is underwater, months of margin erosion have already occurred — and there is no clean data to confirm or quantify the loss. Without a formal engagement profitability analysis, these structural gaps compound quietly until margin erosion becomes impossible to ignore.
This guide provides a repeatable process for building true engagement profitability data inside a CPA practice. You will learn how to reverse-engineer an effective hourly rate for flat-fee and value-priced work, apply CPA job costing principles to service-line analysis, identify which scope creep patterns are systemic, and use those findings to reprice, restructure, or exit the engagements that are destroying margin. Each section builds toward a complete engagement profitability analysis you can run with existing time and billing data, no new software required.
Why Revenue Growth Hides Profitability Problems
A firm billing $1.8 million annually with twelve staff members should, on paper, be thriving. But gross revenue is a poor proxy for health. The Journal of Accountancy has consistently reported that realization rates at many mid-size firms fall between 75% and 85% — meaning 15 to 25 cents of every hour worked is never billed or collected. Across a $1.8 million practice, that represents $270,000 to $450,000 in labor cost generating zero revenue. An engagement profitability analysis often reveals that a handful of clients are quietly subsidized by the firm's most efficient work, distorting the overall picture.
The confusion deepens when firms shift to flat-fee or value-based pricing without building a tracking mechanism to measure the effective hourly rate the firm actually earns. A $3,500 business return feels profitable until the time log shows 22 hours of work — including three rounds of amended organizer data, four emails chasing signatures, and an hour of informal tax advisory that was never scoped. At that rate, the firm earned roughly $159 per hour before overhead. If the fully-loaded labor cost for the staff involved is $85 per hour, the margin is thinner than it appears — and overhead has not even been applied yet. For firms evaluating their engagement profitability analysis approach, this trade-off compounds over time.
This is the core analytical problem that engagement profitability analysis is designed to solve. It forces a firm to look at profit, not just revenue, at the engagement level. See CPA Firm KPIs to Track: Top 10 With AI Automation for the broader metrics framework that engagement-level data feeds into.
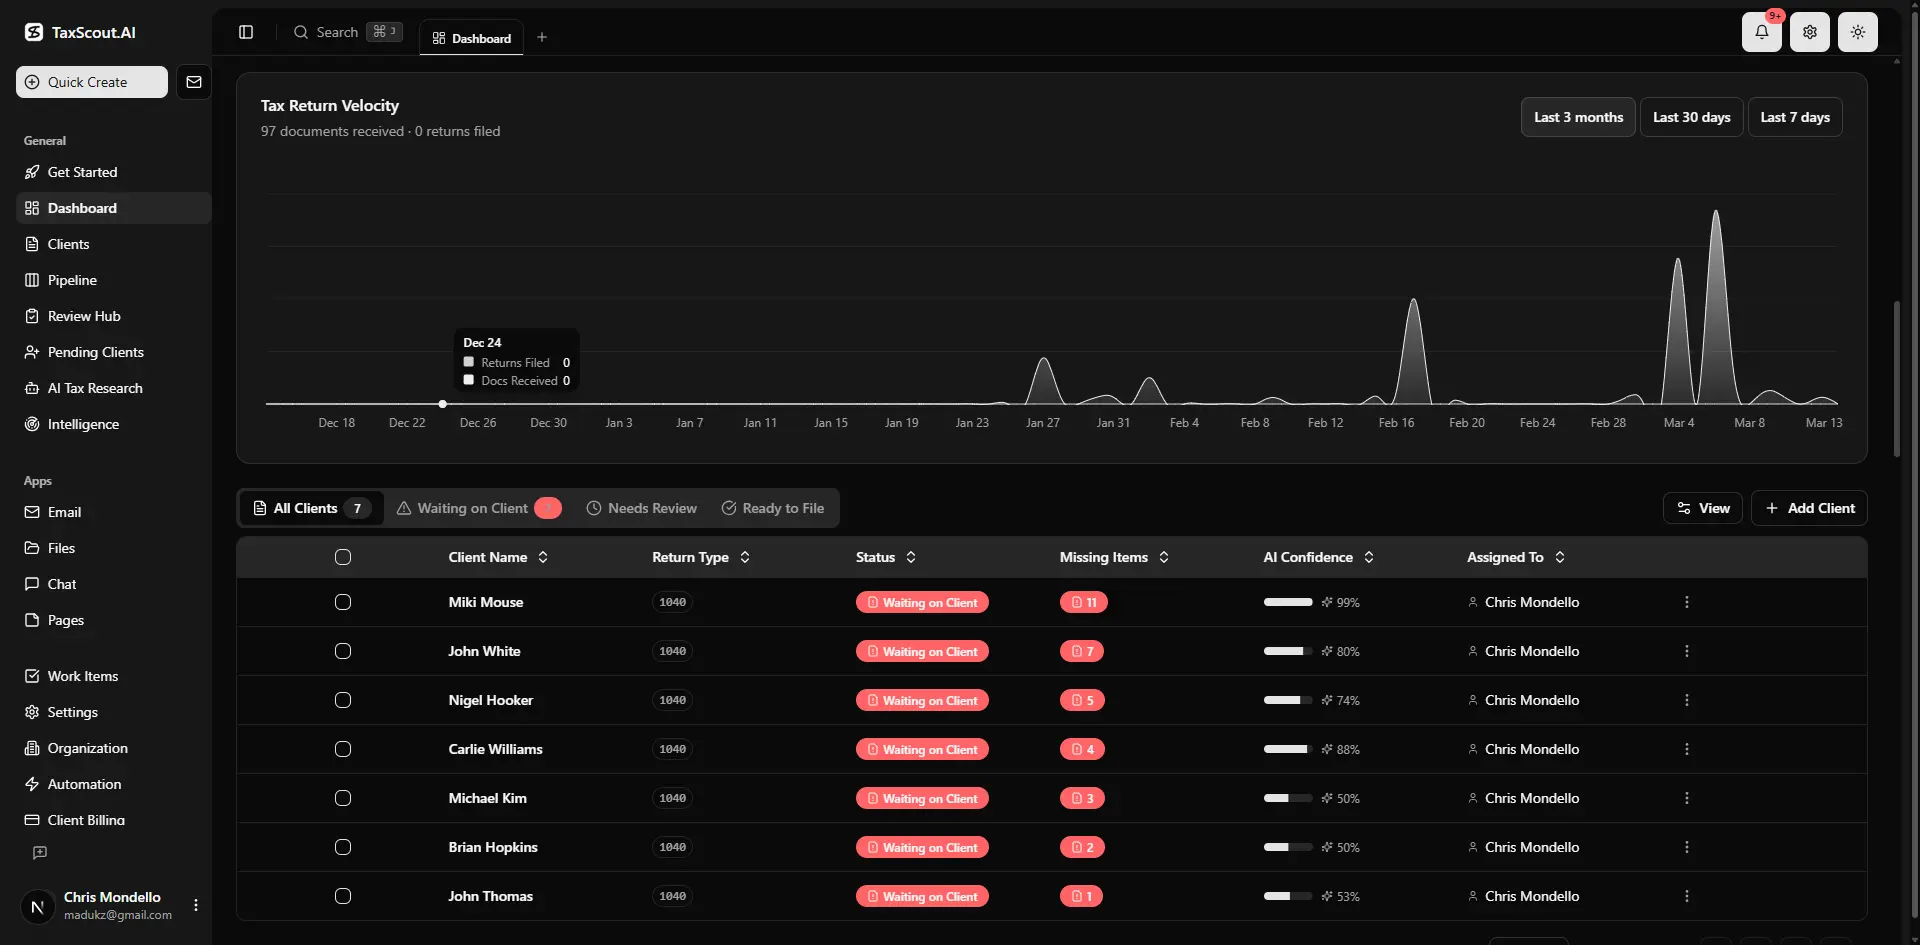 Real-time dashboard showing returns in progress, revenue, and upcoming deadlines
The Four Inputs to True Engagement Margin
Calculating net margin per engagement requires four data inputs: billed fees, actual time logged (including unbilled and written-off time), fully-loaded labor cost per staff member, and an overhead allocation rate. Each of these deserves deliberate construction. Each of these factors directly shapes how engagement profitability analysis plays out in practice.
Billed fees are the starting point but not the endpoint. You need the final collected amount, after any write-downs, discounts, or uncollected balances. The glossary entry on write-down captures this precisely — a write-down is a reduction in billable value that most firms never systematically track at the engagement level. Understanding engagement profitability analysis in this context is what separates firms that scale from those that stall.
Actual time logged must capture all time associated with an engagement, not just time entered against a billing code. Administrative follow-up, document collection emails, informal advisory calls, and correction cycles from client errors all belong in this number. Firms that do not capture this systematically will systematically understate their true cost per client.
Fully-loaded labor cost is the staff member's total compensation (salary plus payroll taxes plus benefits) divided by working hours. For a staff accountant earning $62,000 annually with $14,000 in benefits and taxes, the fully-loaded rate is approximately $37 per hour assuming 2,040 working hours. This is the floor — not the billing rate, not the target.
Overhead allocation assigns a share of rent, software subscriptions, administrative salaries, insurance, and other fixed costs to each engagement. The simplest method is to calculate overhead as a percentage of total labor hours and apply it per hour. For example, if annual overhead is $180,000 and total staff labor is 12,000 hours, the overhead burden is $15 per hour worked. Add this to the fully-loaded labor rate for a true cost per hour.
Tired of guessing which clients actually make money?
TaxScout's pipeline management and invoicing tools give you the operational data to run engagement profitability analysis without building a separate spreadsheet system.
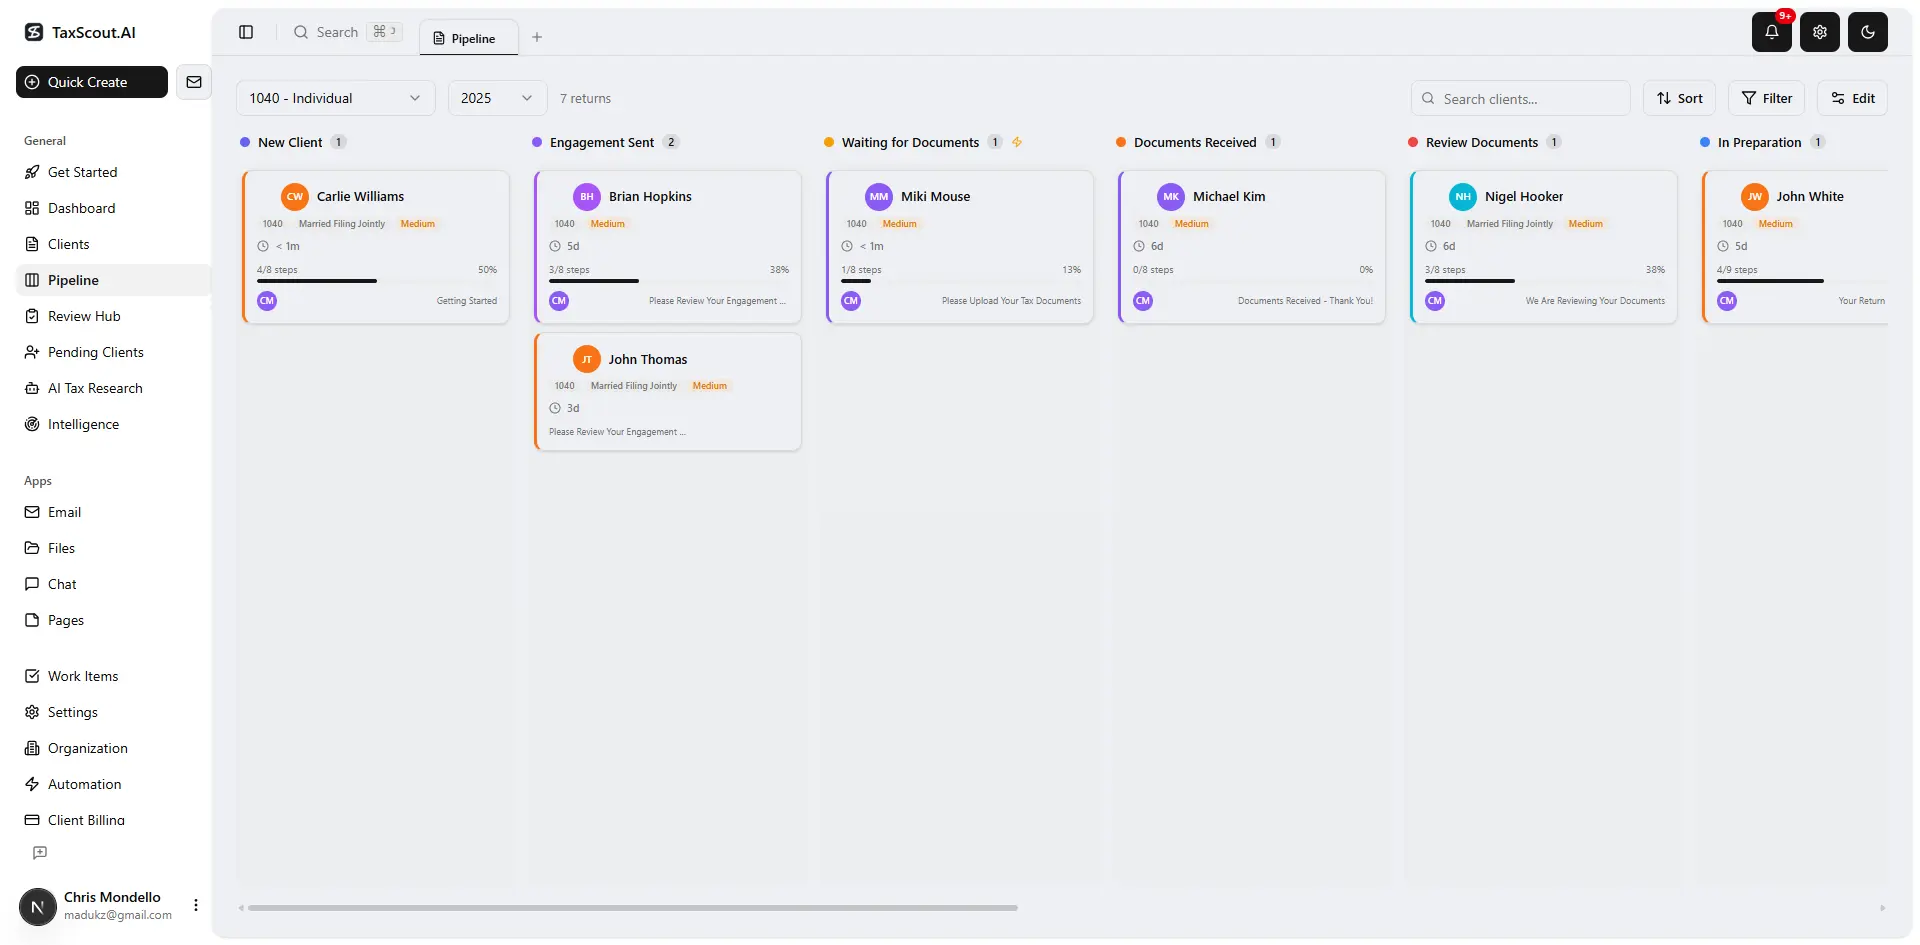 Track every return from intake to filed with drag-and-drop pipeline management
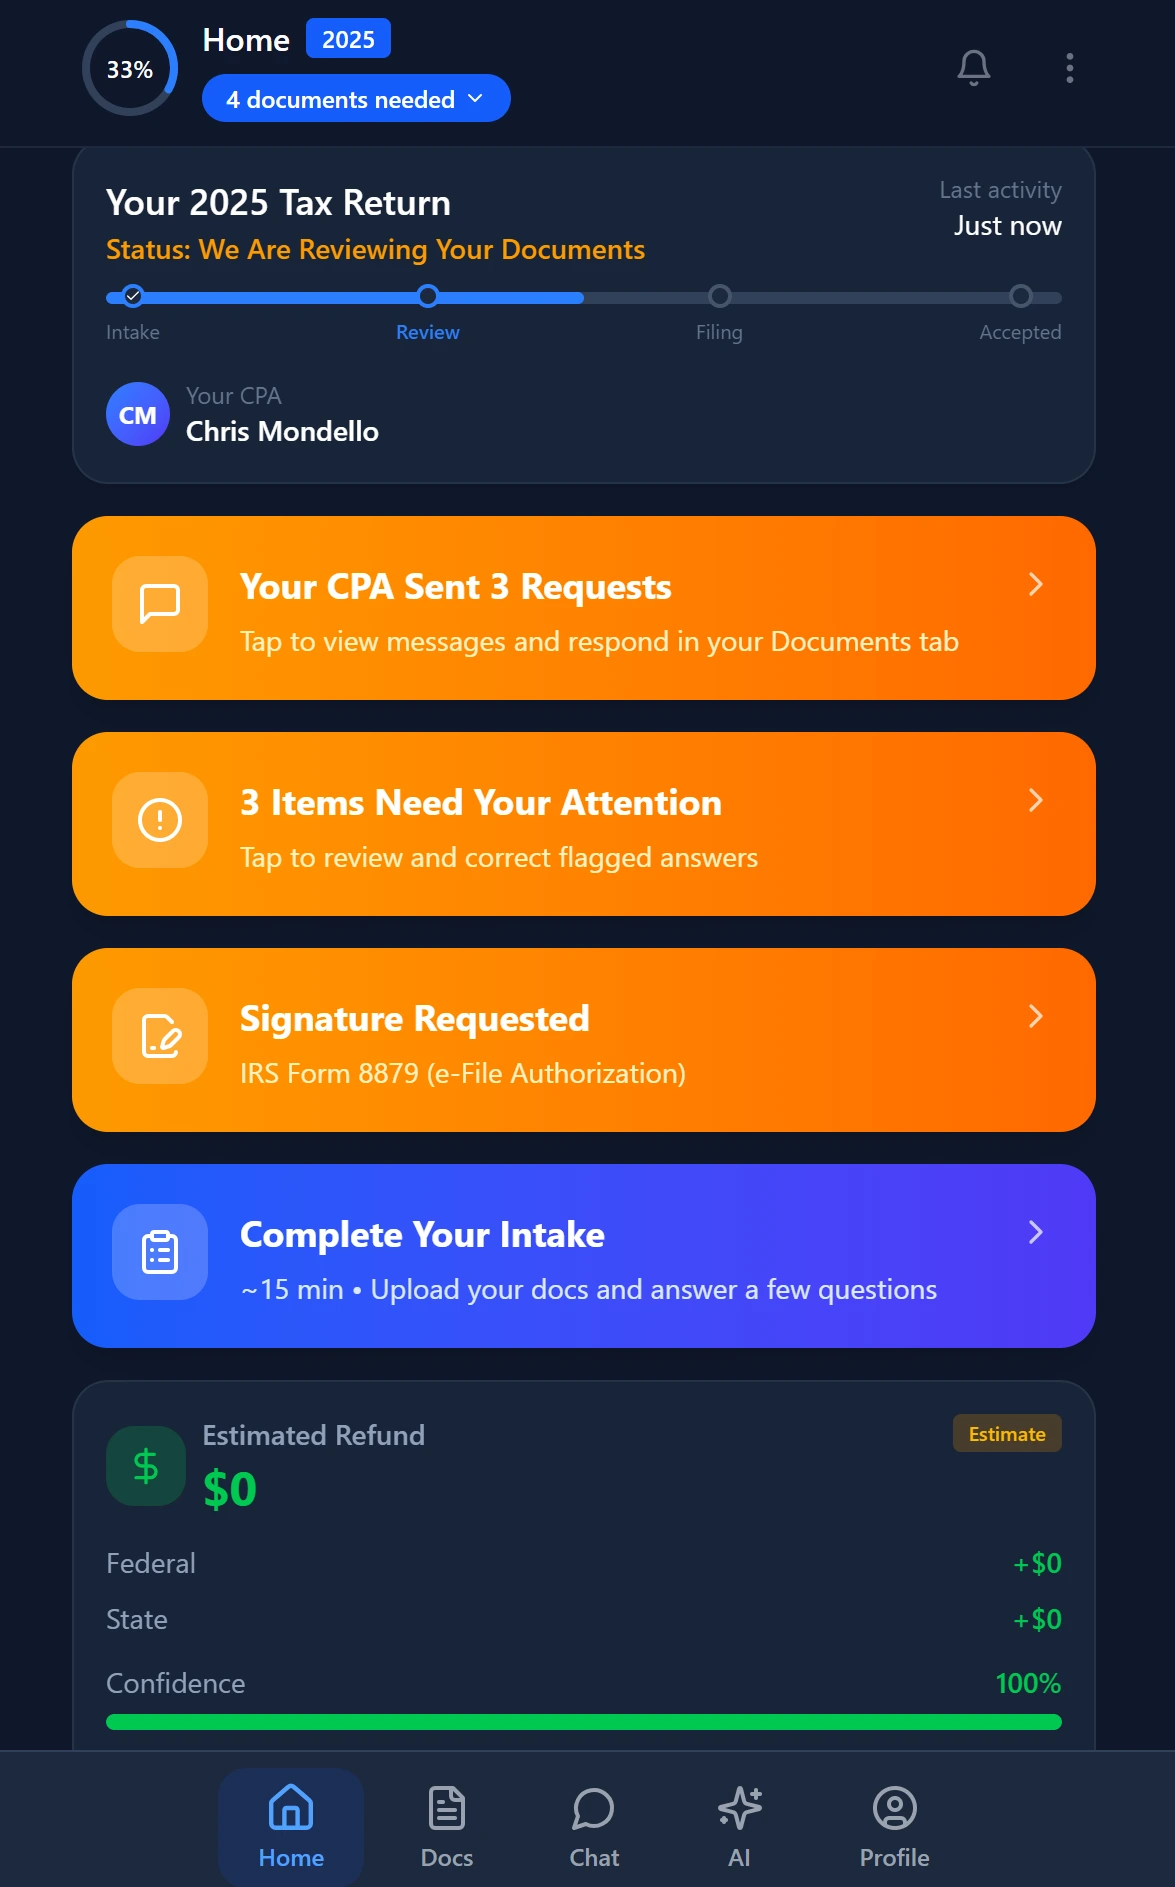 Smart intake auto-fills from uploaded documents and prior-year data
Reversing Into an Effective Hourly Rate for Flat-Fee Work
Flat-fee and value-priced engagements are the most common place where margin erosion hides. The fee is set once, often at the proposal stage, and then the engagement expands incrementally through the year without a corresponding fee adjustment. To measure profitability on these engagements, you need to reverse-engineer what the firm actually earned per hour.
The formula is straightforward: divide the total collected fee by the total hours logged against that engagement (including all staff at all levels). If a $4,200 flat-fee business return consumed 26 hours across a senior accountant and a manager, the effective hourly rate is $161.50. Now compare that to the blended fully-loaded labor and overhead cost for those same hours — say $58 per hour — and the gross margin per hour is $103.50, or roughly 64%.
That 64% sounds acceptable until you compare it to a similar-complexity return that was completed in 14 hours for the same fee: effective rate $300, gross margin 81%. The difference is not complexity — it is scope creep, client responsiveness, and internal workflow efficiency. Tracking this comparison across your book of business is how you identify which clients are structurally unprofitable and which are structurally efficient.
For firms that have read our guide on flat fee billing for CPAs, this effective-rate analysis is the natural next step after adopting fixed pricing — it closes the feedback loop that tells you whether your pricing assumptions held.
Engagement Profitability Analysis by Service Line
Once you can calculate margin per engagement, you can aggregate those margins by service line: individual tax preparation, business returns, bookkeeping, payroll, CFO advisory, audit, and so on. Service line profitability analysis often reveals that a firm's fastest-growing service is also its least profitable.
Bookkeeping is a common example. The recurring monthly fee feels like reliable revenue, but bookkeeping engagements accumulate informal scope additions over time — bank reconciliations for additional accounts, catch-up work for late client submissions, extra communication overhead for disorganized clients. When aggregated across a client roster, bookkeeping margins at many firms run 10 to 20 percentage points below their tax preparation margins.
The Bureau of Labor Statistics Occupational Outlook for Accountants and Auditors confirms that accounting labor costs continue to rise with workforce competition. That pressure makes it increasingly important to deploy labor toward the service lines and client types that generate the highest margin per hour — not just the highest total revenue.
A useful benchmarking tool for service line analysis is the utilization rate metric: the percentage of available staff hours that are logged to client engagements. High utilization on low-margin service lines is a warning sign. It means capacity is being consumed without corresponding profit generation.
Realization Rate Benchmarks by Firm Size
Realization rate — the percentage of worked hours that are actually billed and collected — is one of the most informative signals in engagement profitability analysis. According to data published by CPA society practice management surveys, solo and small firms (under five staff) typically target realization rates above 90%, while mid-size firms (5–25 staff) often operate between 80% and 88% due to write-off culture and informal discounting practices.
Firms that have not measured their realization rate recently often discover it is lower than expected. Common causes include: time entered late and then written off because the manager felt the entry was hard to justify, flat-fee arrangements where the underlying time was never logged at all, and informal discounting for long-tenure clients that is applied at invoicing without documentation. Each of these represents a recoverable loss if identified systematically.
Identifying Scope Creep Patterns
Scope creep rarely appears as a single large overrun. It accumulates through small additions: a quick advisory call about an LLC structure, an extra amended return, a payroll setup question that became a two-hour consulting engagement billed at zero. Tracking these additions requires that every hour — including time for tasks that were never formally scoped — be logged against the relevant client.
Once logged, the pattern becomes visible in the ratio of total hours to scoped hours. If the original engagement estimate was 18 hours and the final total was 29 hours, the scope expansion is 61%. Across ten similar engagements, if the average overrun is 45%, your pricing model has a systematic underestimation problem that needs to be corrected either in the proposal template or through more rigorous change-order enforcement. The IRS Tax Deadlines 2026 guide is a useful reference for planning capacity around peak workload periods where scope creep is most likely to occur undetected.
Engagement Profitability Metrics: What to Track and Why
| Metric | Formula | What It Reveals |
|---|---|---|
| Effective Hourly Rate | Total collected fee ÷ Total hours logged | Whether flat-fee pricing assumptions held |
| Gross Margin per Engagement | (Fee − Labor cost − Overhead) ÷ Fee | True profitability after all direct costs |
| Realization Rate | Billed fees ÷ (Total hours × Standard rate) | How much worked time converts to revenue |
| Scope Expansion Ratio | Actual hours ÷ Estimated hours | Systemic underpricing or scope creep severity |
| Profit per Partner Hour | Net engagement profit ÷ Partner hours on engagement | Partner-level ROI and pricing adequacy |
| Write-Down Percentage | Written-off value ÷ Total billed value | Billing culture and client negotiation patterns |
 Every client gets organized documents, status tracking, and a complete history
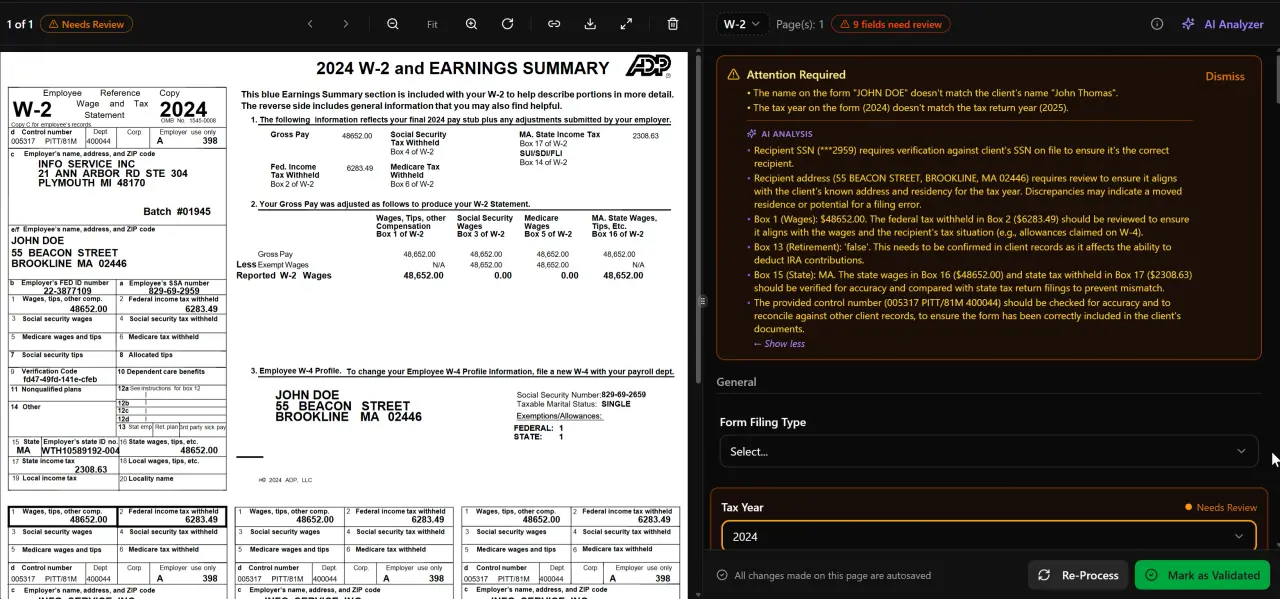 AI classifies, extracts, and validates every document automatically
Building a Client Ranking by True Margin
With engagement-level data in hand, the next step is ranking all active clients by gross margin percentage — from highest to lowest. This ranking is the diagnostic output of a full engagement profitability analysis, and it typically produces one of three findings that require action.
The top quartile — often 25% of clients generating 50%+ of margin — represents your ideal client profile. These engagements are well-scoped, efficiently executed, and priced appropriately for their complexity. The goal is to understand what makes these clients profitable: industry type, service mix, organizational readiness, or the staff team assigned to them.
The middle two quartiles are candidates for repricing or workflow improvement. Many of these clients are profitable but underperforming relative to their complexity. The fix is often operational: tighter intake processes, enforced change orders for out-of-scope requests, or better document collection workflows. AI-powered intake tools that front-load document collection before the engagement begins are particularly effective at reducing the unlogged hours that inflate cost on these mid-tier clients.
The bottom quartile — typically 20–30% of clients generating negative or near-zero margin — requires the hardest decisions: reprice aggressively, restructure the engagement scope, or exit the relationship. The guide on firing your worst clients covers the offboarding mechanics once the profitability data has identified who belongs in this group.
You can find additional frameworks and resources for building firm-wide analytical systems in other blog resources across the TaxScout content library.
How Practice Management Data Enables Ongoing Analysis
A profitability analysis built in a spreadsheet once a year is better than nothing. But the firms that operationalize this process — making it continuous rather than episodic — get substantially more value from the data. That requires connecting time-tracking, invoicing, and pipeline data in a system that surfaces margin signals without manual aggregation.
Pipeline management tools that track engagement status across customizable stages make it possible to correlate where time is being consumed in the workflow with the final margin outcome. If 60% of scope overruns occur during the document collection and review stage, that is an operational signal: the intake process is the fix, not the pricing model.
Invoicing integration is equally important. When fees are invoiced and collected through the same platform that tracks engagement time and cost data, the full margin calculation can be automated. TaxScout's invoicing feature, powered by Stripe Connect Express, connects billed amounts to engagement records — giving firms the raw data needed for engagement margin analysis without manual reconciliation between separate billing and time-tracking systems.
For firms that use multiple software tools — Drake, CCH Axcess, UltraTax, Lacerte — the practice management layer needs to sit above those tools and aggregate profitability data across all return types. TaxScout is designed to work alongside your existing tax software rather than replace it, which means the engagement data it captures is additive to your current workflow rather than disruptive.
The Small Business Administration's financial management resources offer useful context on job costing principles for professional service firms, which translate directly into the overhead allocation and labor cost frameworks described above. Similarly, IRS Publication 15-B is the authoritative source for understanding fringe benefit costs that belong in your fully-loaded labor rate calculations.
 Track firm performance with real-time analytics and client activity monitoring
 Click any extracted field to see its source highlighted on the original PDF
Using CPA Job Costing to Set Better Prices Going Forward
The most durable output of an engagement profitability analysis is not the current ranking — it is the pricing intelligence it generates for future proposals. When you know that S-corporation returns in a specific industry average 21 hours at your firm, and that your blended cost including overhead is $62 per hour, you have an evidence-based floor for proposal pricing: $1,302 in direct cost before any margin is applied.
CPA job costing formalizes this process. Each service type gets a cost model built from historical time data: average hours by phase (intake, preparation, review, delivery), average labor grades involved, and average overhead load. Proposals built on these cost models will price more accurately because they are grounded in what the work actually costs, not what the partner felt was competitive at the time of the proposal.
Value-based pricing does not eliminate the need for this data — it requires it. You cannot price on value delivered if you do not know what delivering that value costs. The floor informs the ceiling. Firms that understand their true cost per engagement can price with confidence at a premium because they know how much margin the engagement generates even at the lower end of their pricing range.
Connecting this back to the post-tax-season review process is a natural workflow: once the season closes, aggregate the engagement data, run the profitability ranking, update the cost models for each service type, and revise fee schedules for the renewal cycle. This annual recalibration, done consistently, compounds into a systematic margin improvement over three to five years.
CPA Firm Profit Per Partner and Practice Valuation
Engagement profitability analysis also feeds into the most important strategic metric for any CPA firm: profit per partner. According to practice management surveys cited by the Journal of Accountancy, high-performing firms consistently maintain profit-per-partner ratios above 35% of gross revenue, while median firms average closer to 25–28%.
The gap between those two bands is almost always explained by client mix and pricing discipline — not headcount or revenue volume. Firms that know which engagements generate margin and actively manage their client portfolio toward higher-margin work outperform firms that grow revenue indiscriminately and absorb the overhead that comes with it.
Practice valuation is the downstream consequence. Firms with documented profitability data, consistent realization rates above 85%, and defensible margin per service line sell at higher multiples than firms with equivalent revenue but opaque cost structures. A buyer acquiring a $2M firm wants to know that $2M is profitable revenue — not just gross billings against an unknown cost base. Engagement profitability analysis, maintained over time, is the evidence that answers that question. See the glossary definition of valuation multiple for context on how buyers translate this data into acquisition pricing.
For a comprehensive view of how law firms and professional service practices are valued, the Cornell Law School Legal Information Institute provides foundational background on professional corporation structures that affect how firm equity and goodwill are treated in transactions.
Do you know your firm's true margin on every engagement?
TaxScout gives CPA firms the pipeline, invoicing, and document data infrastructure to run real engagement profitability analysis — starting at $49/month with unlimited team members.
 Your clients see your brand — OTP login, document upload, and real-time status
Frequently Asked Questions
Engagement profitability analysis is the process of calculating net margin at the individual client or project level by measuring total collected fees against fully-loaded labor cost, overhead allocation, and unbilled time. Unlike revenue reporting, it reveals which clients and service lines actually generate profit after all direct and indirect costs are applied.
Stay up to date
Get the latest tax tech insights delivered to your inbox.